Why This Series Exists
My career in R&D—spanning more than fourteen years—has taken me through a wide range of optical sensing projects. I’ve worked with light in many forms: absorbed, scattered, transmitted, reflected, refracted. And every time, I found myself fascinated by the same simple truth:
Light always has something to say; we just need to learn how to read it.
Over the years, I also noticed that many talented engineers hesitate when it comes to optical sensing. Not because they lack skill, but because the topic is often presented in a way that feels overly academic or fragmented.
This series aims to bring clarity. My intention is to share the practical foundations of optical sensing—the version we use in real engineering work—while keeping the explanations accessible and structured.
Series Outline
When I began writing, I envisioned this as a five-week series. As the work developed, that original schedule naturally changed: the first two subjects became standalone articles, while the broad third subject—optical elements—grew into several focused articles. Rather than compressing these topics to fit the initial plan, I chose to give each one the space it needed.
The published reading order is:
- Part 1 – Foundations: light–matter interactions, application areas, and wavelength selection (this article)
- Part 2 – Transmitter & Receiver Selection: LEDs, lasers, photodiodes, phototransistors, and final component selection
- Part 3A – Optical Elements: Lenses: lens terminology, lens types, aberrations, and collimation
- Part 3B – Optical Elements: Polarization: polarization, birefringence, polarizers, and practical applications
- Part 3C – Optical Elements: Prisms: beam steering, image transformation, and dispersive and non-dispersive prisms
- Part 3D – Optical Elements: Retroreflectors: corner cubes, cat’s-eye reflectors, and retroreflective foils
I hope you enjoy reading this series.
Let’s begin.
2. Overview of Optical Interaction Principles
Optical sensing systems extract information based on how light interacts with an object. Every object in the real world handles light differently:
- Some absorb it
- Some reflect it
- Some scatter it
- Some transmit it
- Some refract it
This leads to a fundamental rule in optical sensing:
Emit (or collect) light → measure its interaction → convert the measurement into a decision.
Below are the key physical behaviors used in optical sensing, along with real industrial applications.
2.1. Absorption
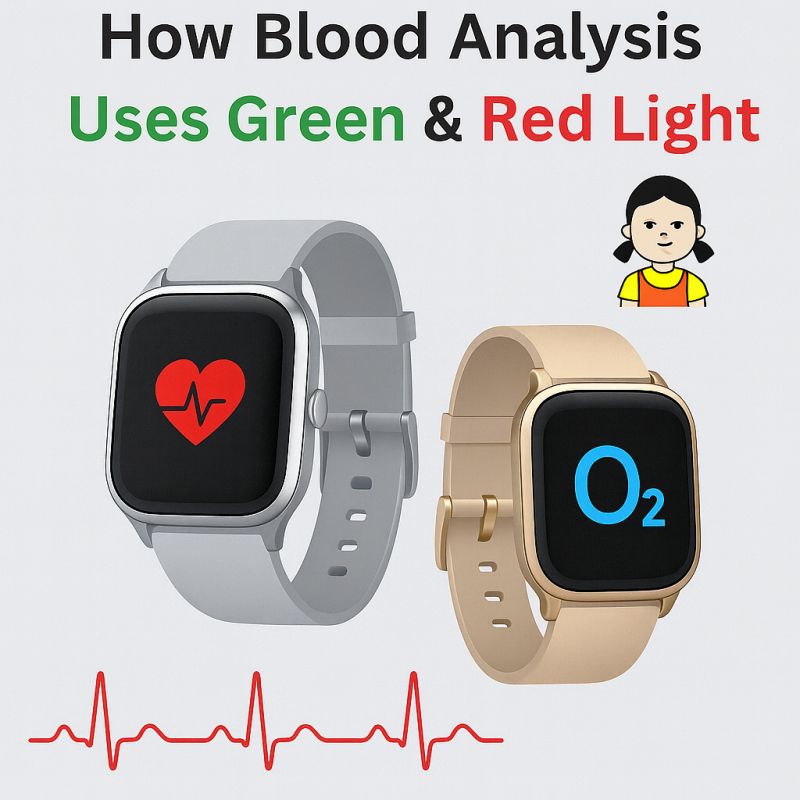
Certain wavelengths of light are absorbed by materials at different rates. This is heavily used in medical devices, food analysis, and quality inspection systems.
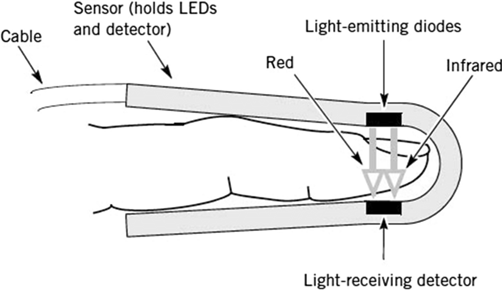
Example: Pulse Oximeter
- 660 nm and 940 nm light pass through the finger.
- Oxygenated hemoglobin absorbs these wavelengths differently.
- The sensor measures the absorption ratio and calculates oxygen saturation.
2.2. Reflection (Back Reflection)
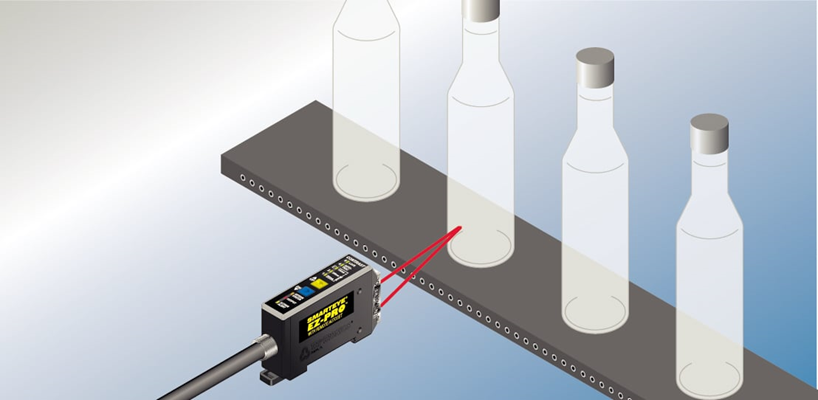
An object’s color, brightness, and surface texture affect how much light it reflects. Diffuse sensors and color-recognition systems operate using this principle.
Example: Diffuse Sensor
Light hits the surface → returns depending on surface properties → the sensor decides “object present / not present.”
2.3. Scattering
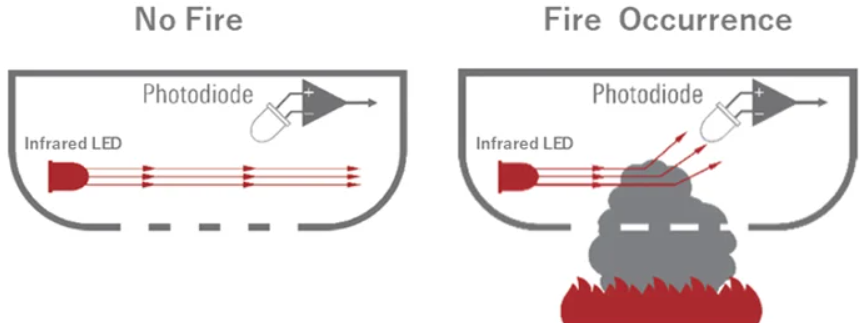
Smoke, fog, and airborne particles scatter light. Smoke detectors and particle-measurement instruments use this effect.
Example: Optical Smoke Detector
An LED illuminates the chamber → smoke scatters the light → scattered light reaches the photodiode → increasing intensity triggers the alarm.
2.4. Interruption / Occlusion
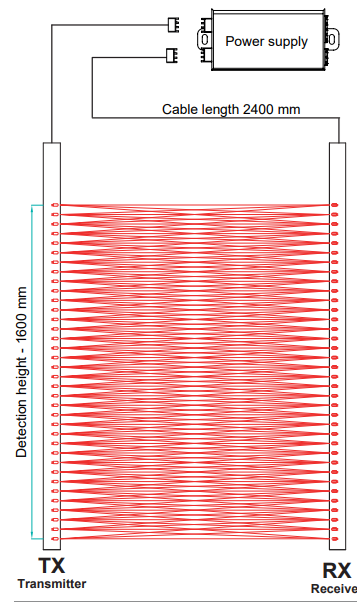
The emitter and receiver face each other; when an object blocks the beam, light is interrupted. This is the basis of door sensors, turnstiles, and safety barriers.
2.5. Transmission
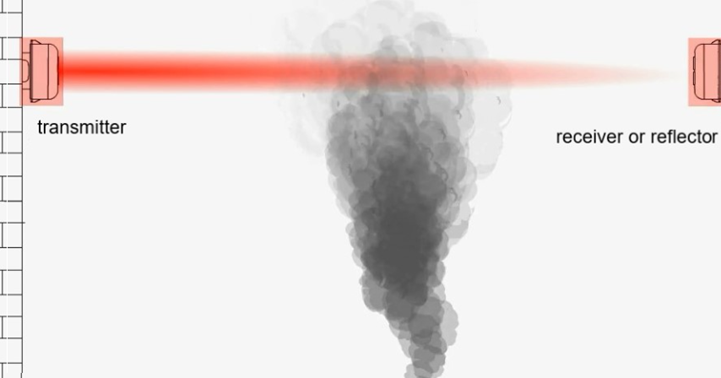
In transmission-based sensing, the amount of light passing through a material is measured. Changes in smoke, gas concentration, or liquid properties can be detected this way.
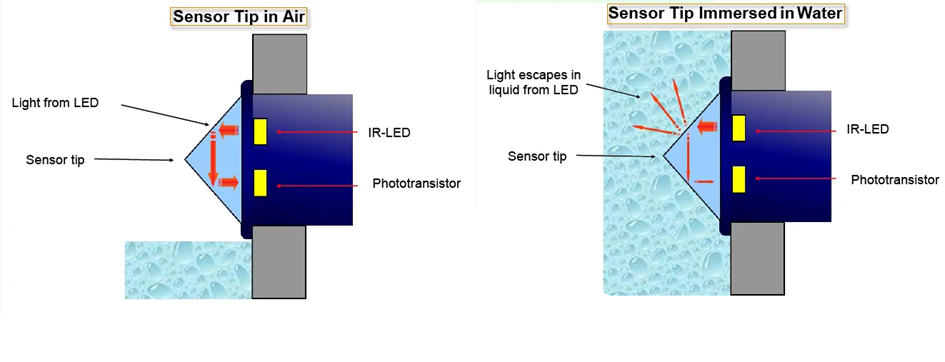
2.6. Refraction and Optical Density
Liquids and transparent materials refract light. Changes in refraction angle can reveal liquid level, foam presence, or density variations.
2.7. Time of Flight (ToF)
Light is emitted, hits a target, and the return time is measured. Distance is calculated from the round-trip time.
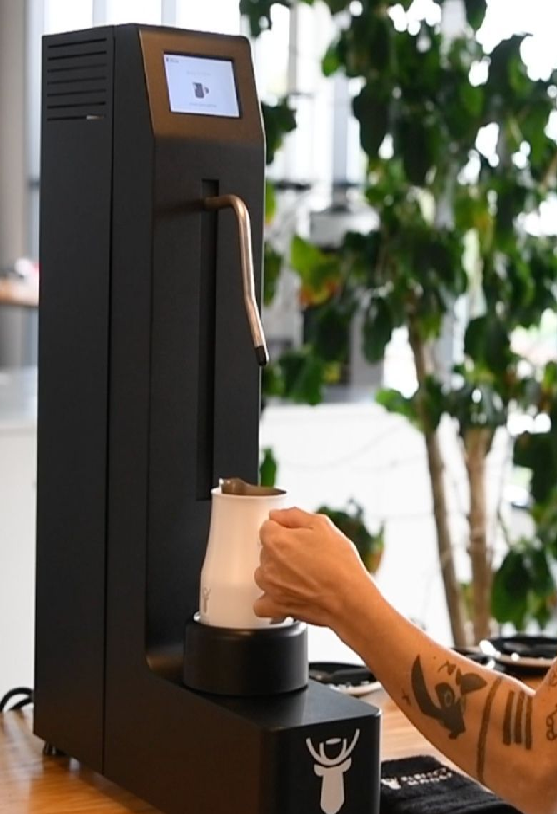
Example: Foam Detection in Coffee Machines
In a suitably designed system, a ToF sensor can track the foam surface: as the foam rises, the measured distance decreases and the controller can regulate the process. Figure 07 shows the application context only; the product image does not reveal or verify an internal ToF architecture.
2.8. Speckle Pattern (Laser Roughness Measurement)
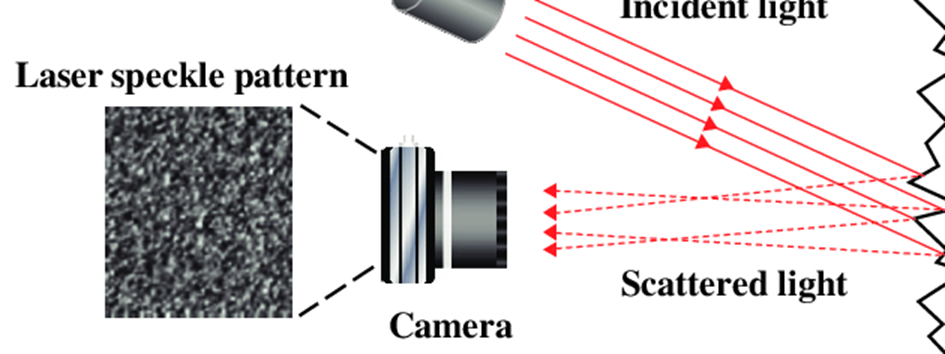
When a laser hits a rough surface, it produces a random speckle pattern. This pattern serves as an optical signature for surface roughness.
2.9. Spectral Signature
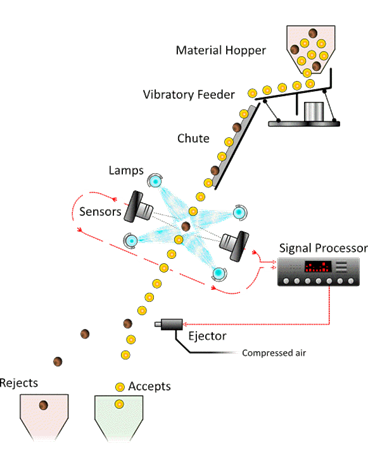
Every material has a unique optical signature at certain wavelengths—such as the UV/IR signature of flames, NIR reflection differences between plastic types, or spectral distinctions between rice and stones.
These unique signatures allow optical systems to identify and classify materials.
2.10. Diffraction and Pattern Analysis
When light passes through a slit or edge, it creates diffraction patterns. These patterns reveal detailed geometric information about the surface or structure.
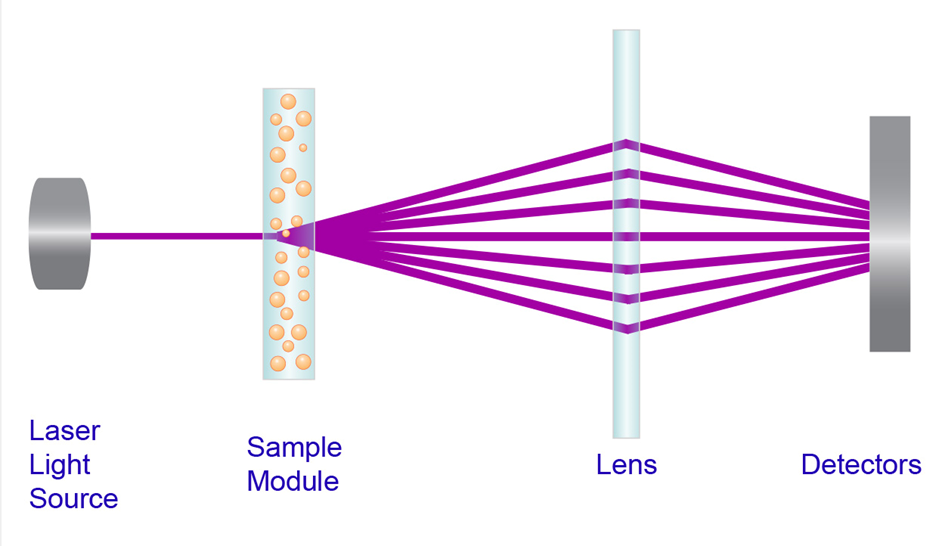
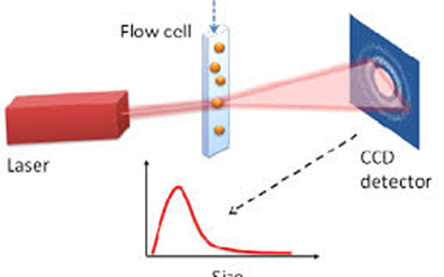
Example: Laser-Diffraction Particle-Size Measurement
Particles passing through a laser beam produce an angular scattering and diffraction pattern. A lens maps that pattern onto a detector array, allowing the particle-size distribution to be estimated.
3. The Spectrum of Sensing – Why Wavelength Matters
“Light is the oldest messenger in nature.” — Albert Einstein
Optical sensing is essentially the process of reading this message. However, what the light tells us depends entirely on the wavelength we observe it in.
As explained in David Attenborough’s Life in Color documentary, many herbivores perceive orange as a shade of green. Therefore, a tiger appears bright to us but blends into the background for a deer.
This demonstrates a fundamental truth:
The same object can produce entirely different realities at different wavelengths.
This is why wavelength selection is one of the most critical decisions in any optical sensing project.
Wavelength = Energy
The Physics That Determines What Light Reveals
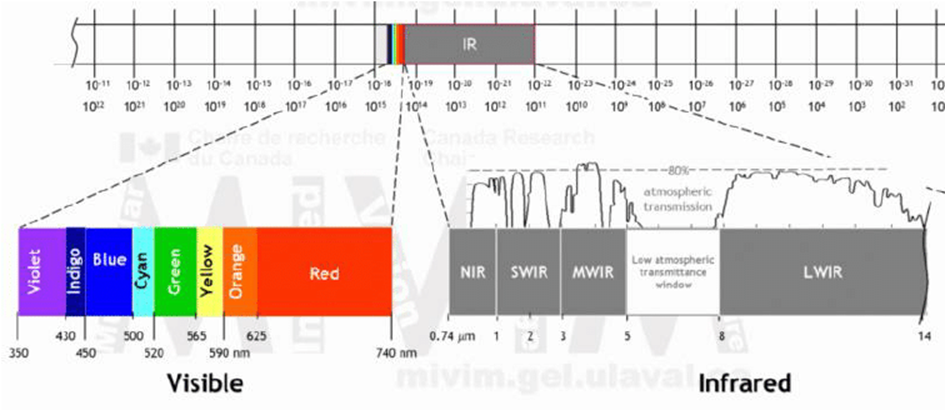
As wavelength decreases, energy increases; as wavelength increases, energy decreases:
- Short wavelengths (UV–VIS–NIR) → high energy → object details become more pronounced
- Long wavelengths (Mid-IR–LWIR) → lower energy → background noise increases, making separation more difficult
Examples:
- LWIR band: Since almost everything—including humans—emits thermal radiation in this region, the target signal must be separated from a highly active background. This is why thermal imaging is inherently complex.
- Mid-IR band: Only gas molecules produce sharp absorption peaks in this wavelength range, allowing NDIR gas sensors to operate with very high accuracy.
3.1. Detailed Examination of Wavelength Regions
3.1.1. Ultraviolet – UV (180–400 nm)
Used in fluorescence, contamination inspection, and flame detection. UV light is high-energy and reveals features invisible under visible light.
1) Leak Detection Using Fluorescent Dye
Fluorescent dye glows bright green/blue under UV illumination.
Applications:
- HVAC and refrigeration systems
- Hydraulic line leak detection
- Automotive fluid inspection
Block Diagram: UV LED → Surface → Fluorescence → Optical Filter → Photodiode / Camera
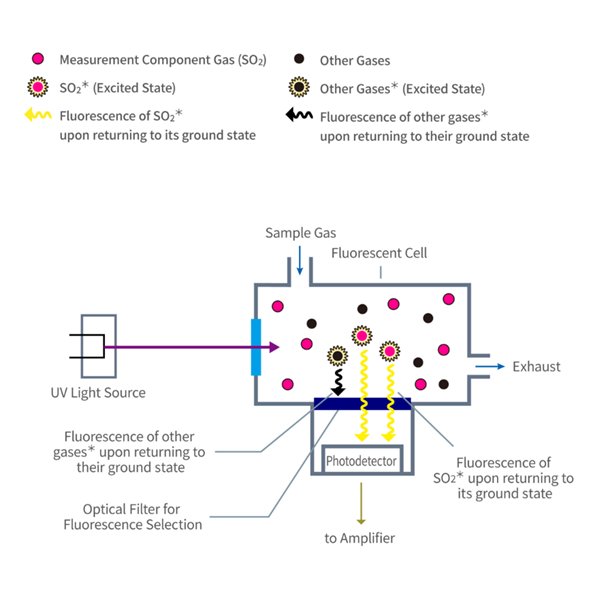
2) UV Fluorescence Gas Measurement
UV fluorescence is also used in analytical instruments. In the example below, sulfur dioxide molecules are excited by UV light and their fluorescence is measured selectively by a photodetector.
3) UV Marker / Security Ink Reading
Invisible UV-reactive ink becomes visible when illuminated with UV light.
Applications:
- Banknote authentication
- Logistics package verification
- Pharmaceutical packaging security
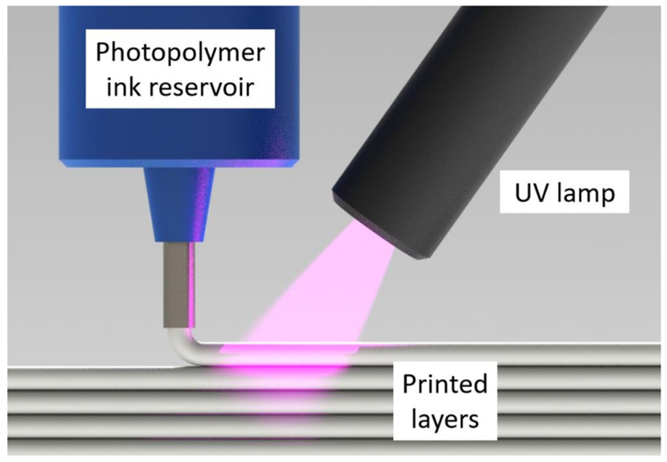
4) UV Curing and Photopolymerization
UV light can initiate polymerization in photosensitive resins and inks. This principle is widely used in additive manufacturing, printing, and coating processes.
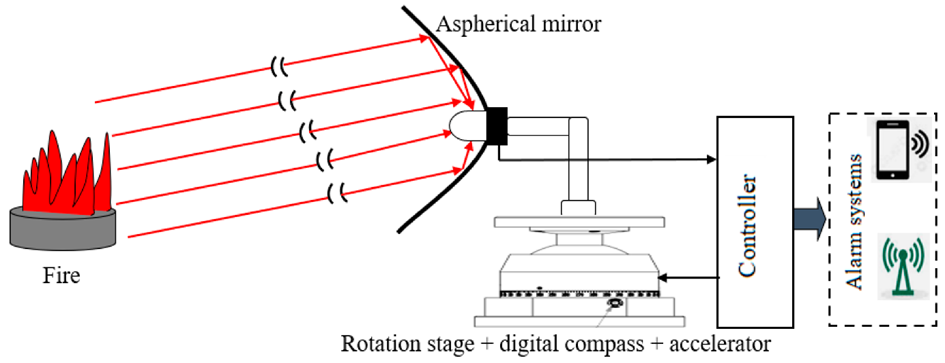
5) UV Flame Detection (180–260 nm)
Flames emit natural UV radiation in this band. Solar influence is minimal → very low false alarm rate.
Applications: refineries, natural gas systems, paint curing ovens.
Block Diagram: Flame → Band-Pass Filter → UV Photodiode → Amplifier → Alarm
3.1.2. Visible Spectrum (400–700 nm)
The primary band for color, contrast, printing, and surface inspection. This is the same band the human eye perceives, and it is widely used in industrial automation.
1) Color Detection and Classification
Color information is obtained using white/RGB LEDs and photodiode arrays.
Applications:
- Food sorting
- Plastic classification
- Label verification
- Textile inspection
Block Diagram: LED → Object → Reflection → Color Sensor → Digital Analysis
2) Contrast Sensors (Black–White Detection)
Essential in printing and labeling processes.
Applications:
- Label cutting and alignment
- Barcode/marker detection
- Paper processing
Block Diagram: LED → Surface → Reflection → Photodiode → Thresholding → Output
3.1.3. NIR – Near Infrared (700–1100 nm)
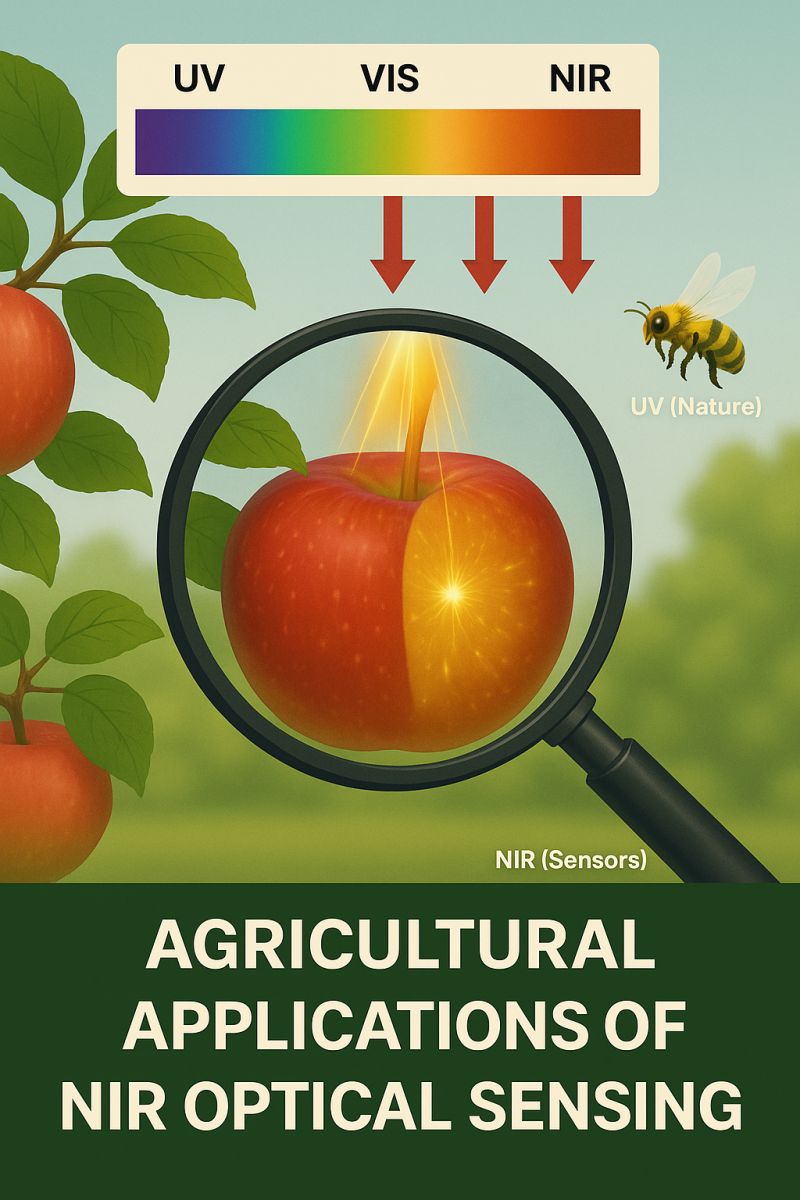
A band that penetrates the internal structure of organic materials. Unlike visible light, NIR enters fruits, plants, food products, and biological tissues.
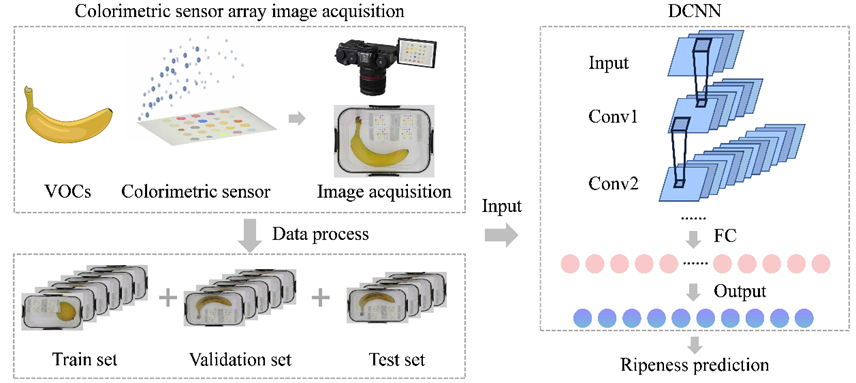
1) Fruit Ripeness Detection
Chemical changes related to ripeness are clearly detectable in NIR.
Applications: apples, mangos, avocados; internal defect detection.
Block Diagram: NIR LED → Fruit → Absorption → NIR Photodiode → Spectral Analysis
2) Biological Tissue Detection (Medical / Laboratory Applications)
Blood, skin, and biological tissues transmit and absorb NIR light at different rates. With NIR illumination, the following can be achieved:
- Vein detection
- Subdermal bruise/bleeding visualization
- Non-invasive measurements
- Tissue oxygenation analysis
Block Diagram: NIR LED → Tissue → Transmitted/Scattered Light → Photodiode → Tissue Analysis
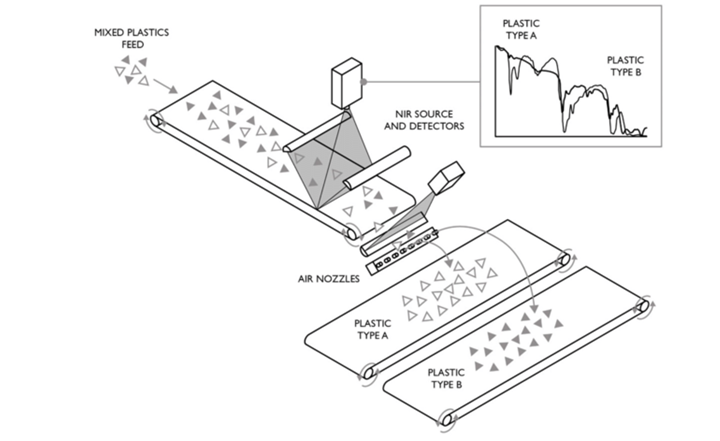
3) Industrial Material Separation (Paper / Textile / Organic vs. Inorganic)
Organic materials reflect NIR light differently, enabling automated classification processes such as:
- Textile sorting
- Recycling line separation
- Paper coating inspection
Block Diagram: NIR Illumination → Surface → Spectral Response → Classification
3.1.4. SWIR – Short Wave Infrared (1.0–2.5 µm)
SWIR is powerful because it distinguishes materials that look identical in visible and NIR bands. Chemical composition differences, moisture content, and subsurface features become clearly visible in SWIR.
Below is a summary of the most characteristic SWIR applications:
1) Plastic Type Identification (PET – PVC – PE – PP)
Plastics that appear identical in visible and NIR bands exhibit completely different reflection signatures in SWIR.
Where is it used?
- Recycling facilities
- Granule/plastic quality inspection lines
Block Diagram: SWIR LED → Plastic → InGaAs Sensor → Spectral Separation
2) Subsurface Defect Detection
SWIR makes certain materials appear semi-transparent. This enables visibility of:
- Coating-under cracks
- Air bubbles inside plastics
- Composite delamination
Block Diagram: SWIR Illumination → Material → Camera → Defect Map
3) Foreign Object Detection in Food
Chemical structures separate more sharply in SWIR, allowing detection of:
- Stones mixed with rice
- Plastic/wood fragments inside food products
Block Diagram: SWIR Light → Product → Reflectance → Classification
3.1.5. Mid-IR (3–5 µm)
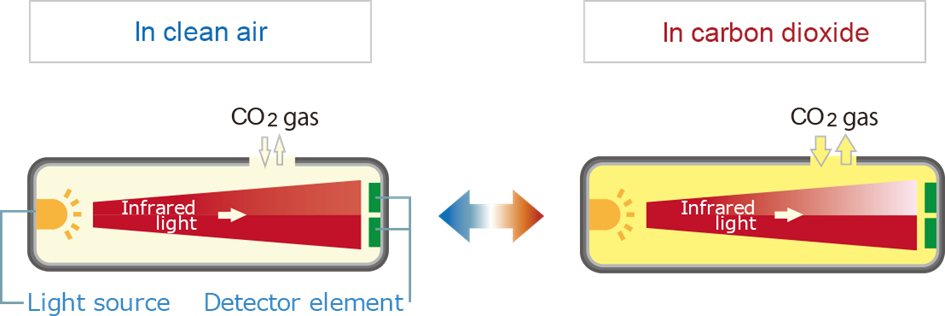
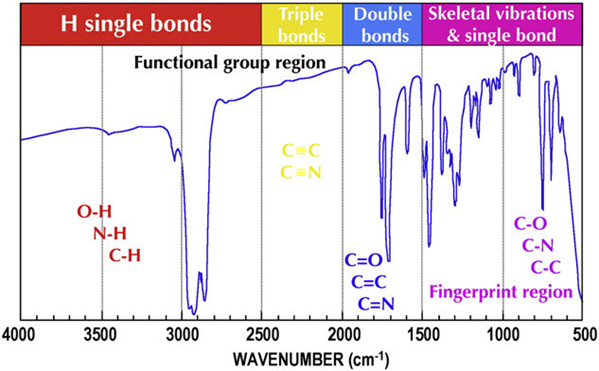
The “fingerprint region” for gas molecules. Many gases have strong and highly specific absorption lines in this band. This makes Mid-IR uniquely suited for gas detection.
1) NDIR Gas Sensors (CO₂ – CH₄ – CO – SF₆)
Each gas absorbs a very specific wavelength in the Mid-IR region:
- CO₂ → 4.26 µm
- CH₄ → 3.3 µm
- CO → 4.7 µm
This is why NDIR systems are simple yet extremely effective.
Block Diagram: IR Source → Gas Chamber → Band-Pass Filter → Thermopile → Absorption Measurement
Where is it used?
- Ventilation / Indoor Air Quality
- Industrial gas leak detection
- Biogas / natural gas systems
- CO₂ monitoring in enclosed spaces
2) Flame Spectrum Analysis (IR Flame Detector – MWIR)
In some critical environments, UV alone is not sufficient. Flames exhibit strong, distinctive IR emissions in the 3–5 µm band, making Mid-IR flame detectors highly reliable.
Advantages:
- No influence from sunlight
- Very low false alarm rate
- Flame type and combustion characteristics can be analyzed
Block Diagram: Flame Emission → IR Filter (3–5 µm) → Pyroelectric Sensor → Decision Logic
3) Chemical Substance Analysis via IR Spectroscopy
Molecules absorb light at their vibration frequencies in the Mid-IR region. This makes it the most reliable band for chemical identification.
Applications:
- Oil/lubricant quality analysis
- Paper–plastic identity verification
- Compact laboratory FTIR systems
Block Diagram: IR Source → Sample → Absorption Spectrum → Analysis
3.1.6. LWIR – Long Wave Infrared (8–14 µm)
The thermal sensing band.
In this range, all objects emit their own thermal radiation—so LWIR sensors work passively (no illumination is required).
While visible/NIR/SWIR imaging relies on reflected light, LWIR directly observes the temperature of the object.
1) Thermal Cameras (Microbolometer Sensors)
Special microbolometer arrays are used in this band. Each pixel heats up according to incoming IR energy → its resistance changes → temperature information is produced.
Where is it used?
- Machine fault diagnostics
- Electrical panel temperature monitoring
- Building insulation analysis
- Human/mammal detection (security systems)
Block Diagram: Thermal Radiation → LWIR Lens → Microbolometer → Readout Electronics → Thermal Image
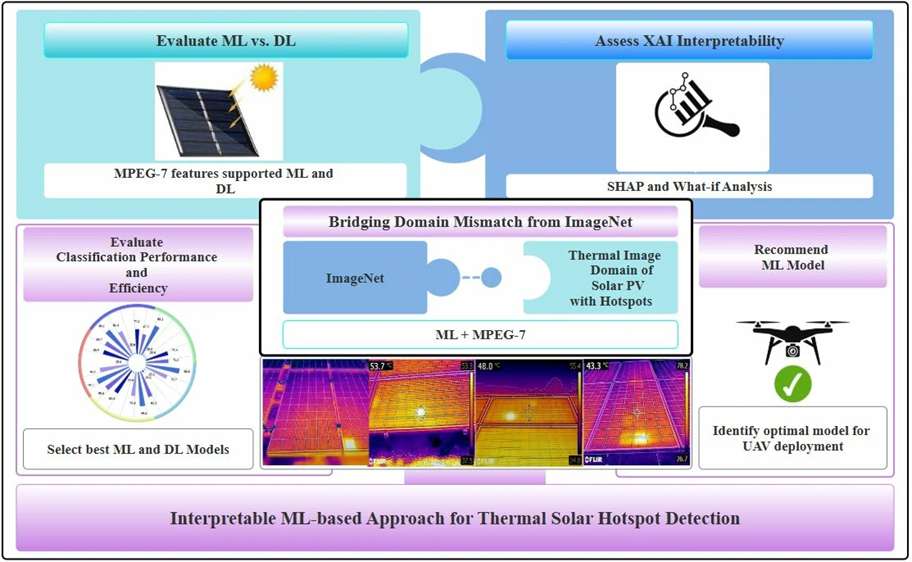
2) Temperature Distribution and Hotspot Detection
Because LWIR can resolve temperature differences at millikelvin levels, it can detect:
- Bearing overheating
- Hot cable junctions
- MOSFET overload in inverters
- Cell-level heat imbalance in battery packs
3) Human / Living Being Detection (Security, Rescue Operations)
The human body emits strong IR radiation in the 9–13 µm band. This makes people visible even in darkness, smoke, or fog.
Applications:
- Search and rescue (detecting survivors under rubble)
- Night-time security cameras
- Wildlife/forest fire rescue monitoring
- Military thermal imaging systems
Block Diagram: Body Heat → IR Lens → Sensor Array → Contour/Heat Map → Detection
Summary
As we have seen in this section, wavelength is not merely a matter of “color.” It fully determines how a sensor perceives the world, what information it can extract, and which objects it can detect under different conditions.
The same object appears as:
- Contamination under UV
- Color and texture under Visible
- Internal structure under NIR
- Material differentiation under SWIR
- Gas absorption signature under Mid-IR
- Heat distribution under LWIR
Therefore, the very first question in optical system design is always:
“What exactly do I want to observe, and at which wavelength does this information become visible?”
Closing
In this part, we explored the spectrum domain that forms the foundation of optical sensing. We saw that each wavelength band reveals a completely different layer of reality.
If there is a detail you are curious about, a situation you have encountered in your own project, or a concept you would like me to clarify further, feel free to share your questions in the comments. I will be happy to respond to each one.
Continue with Part 2 – Transmitter & Receiver Selection.
References
- SST Sensing Ltd., Optical Liquid Level Sensor Operating Principle, AN0041.
- Senarathna et al., IEEE Reviews in Biomedical Engineering, 2013.
- Novanta / Laser Quantum, Highly Accurate Particle Measuring Using Lasers, 2021.
- National Research Council Canada, Infrared Vision, 2015.
- HORIBA, APSA-380 Sulfur Dioxide Monitor.
- Truong et al., Applied Sciences, 2023.
- Zhao et al., Foods, 2024.
- Taneepanichskul et al., Frontiers in Sustainability, 2022.
- HKUST, Clean Air Challenge – Infrared CO₂ Sensing.
- Fernando et al., Information, 2025.