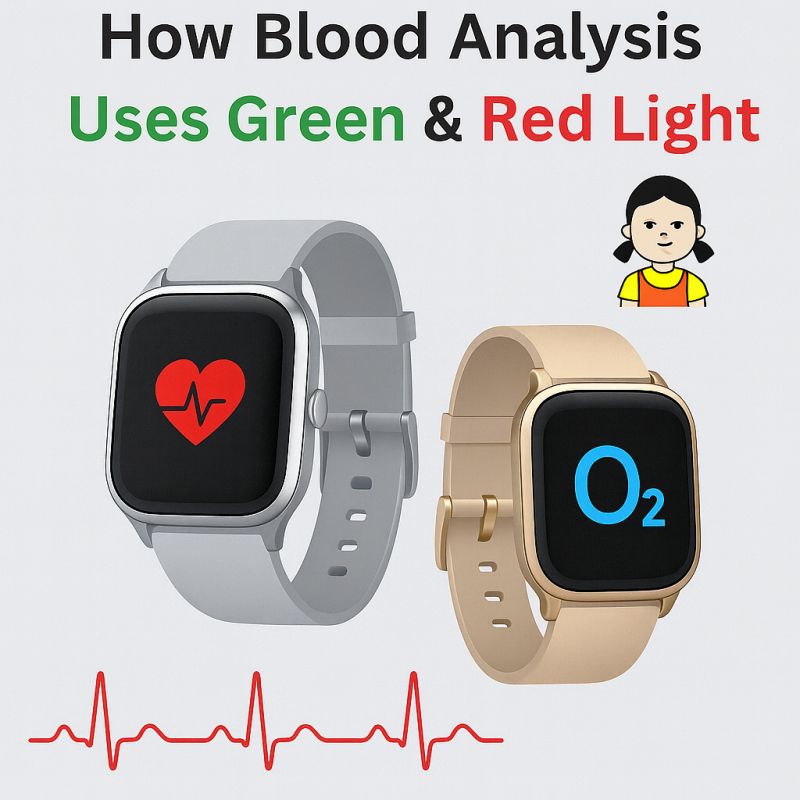
Turn over a smartwatch and you may see green, red and infrared (IR) LEDs beside one or more photodiodes. Those colors are not interchangeable. Each wavelength is absorbed and scattered differently in tissue, so the returning light carries different information about the changing blood volume beneath the sensor.
The underlying measurement is photoplethysmography (PPG). The LEDs illuminate the skin, and a photodiode converts the returning light into an electrical signal. Part of that signal changes with each heartbeat. The device processes this small pulsatile component against a much larger background from skin, tissue, non-pulsatile blood and ambient light. In a wrist-worn device, the LED and photodiode usually sit on the same side of the skin, forming a reflectance measurement; a fingertip pulse oximeter commonly measures transmitted light instead. Analog Devices: SpO₂ measurement principles
Green light: following the pulse
Green light is absorbed strongly by blood and samples relatively superficial tissue compared with red and IR light. At the wrist, this often produces a useful pulsatile PPG signal with comparatively good resistance to motion artifacts. The spacing between LED and detector, contact with the skin, optical shielding and signal processing still determine whether the heartbeat can be tracked reliably. Green is therefore a common heart-rate choice for wrist wearables, not a guarantee of the strongest or most accurate reading on every person and at every body site. Analog Devices: wearable wavelength selection, Analog Devices: pulse-oximeter design
Red and infrared light: estimating oxygen saturation
The oxygen-carrying protein hemoglobin has different absorption spectra depending on whether it carries oxygen. At a typical red wavelength near 660 nm, deoxygenated hemoglobin absorbs more strongly than oxygenated hemoglobin. Around 940 nm in the infrared, the relative relationship reverses. That contrast is why pulse oximetry uses two wavelengths rather than treating either LED as a direct oxygen meter. Texas Instruments: pulse-oximeter design guide, Analog Devices: SpO₂ measurement principles
For each wavelength, the electronics separate the heartbeat-related variation (AC) from the more stable background (DC). A typical algorithm compares the normalized red and IR signals as a ratio of ratios:
R = (AC_red / DC_red) / (AC_IR / DC_IR)
A calibration then maps this optical ratio to an estimate of peripheral arterial oxygen saturation, SpO₂. It is the changing relationship between two optical signals that matters—not simply how much red or IR light returns at one moment. Analog Devices: calibration and ratio-of-ratios method
Why the complete optical design matters
The photodiode cannot tell by itself whether a photon came through useful tissue or reached it through an internal reflection. Poor optical isolation, ambient light, loose contact and movement can bury the small PPG variation. LED timing and an LED-off ambient measurement, detector placement, shielding, low-noise readout and signal processing are all part of the system design. Analog Devices: optical integration guidance, Analog Devices: pulse-oximeter design
Finally, a consumer wearable’s SpO₂ number is an estimate, not a comprehensive blood analysis or a substitute for a clinically validated instrument. Performance can vary with motion, perfusion and skin pigmentation; the US FDA has highlighted differences in pulse-oximeter accuracy across skin tones and distinguishes general-wellness devices from devices evaluated for medical use. FDA: pulse-oximeter performance across skin tones
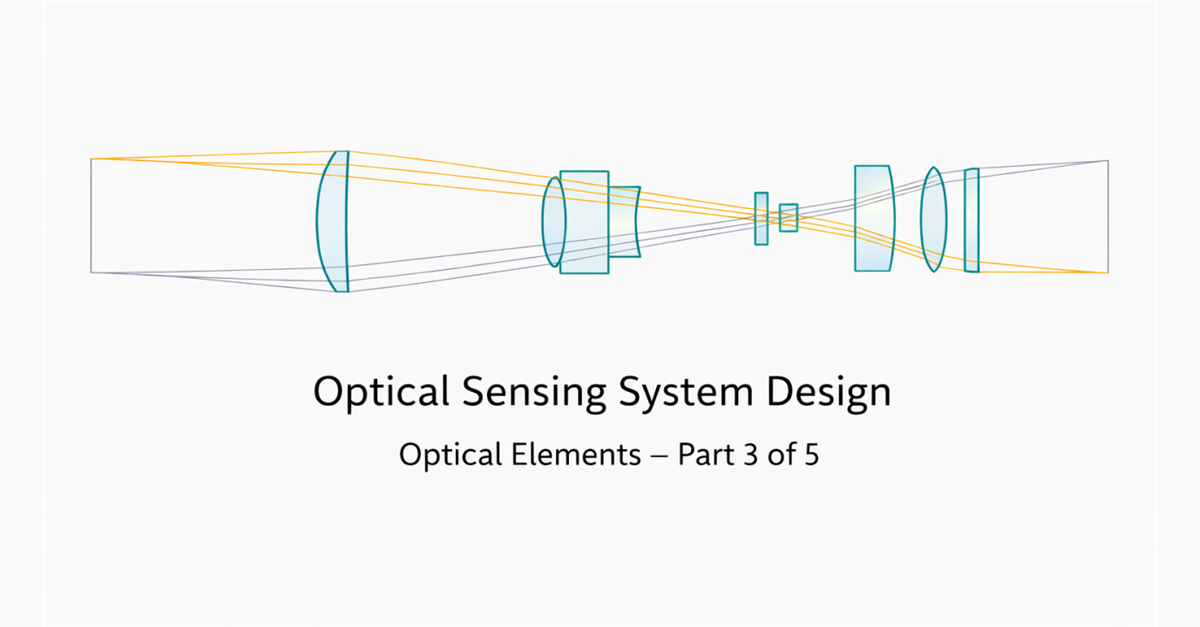
The design lesson is simple: green, red and IR LEDs provide different views of the same tissue, but useful physiological estimates come from optics, electronics and calibration working together. That systems perspective also runs through my Optical Sensing System Design series.
Cover illustration from my original post; “blood analysis” in the graphic is a broad visual label, not a claim that a smartwatch performs a laboratory blood test.
Related overview shared with the original post: LED–photodiode interaction in wearable sensors.