1. Introduction
When we look at images captured by large telescopes, the universe often appears to be filled with almost mythical colors. Red nebulae, blue clouds of gas, golden star clusters, and galaxies billions of light-years away are among the most fascinating products of modern astronomy.
Yet these images are far more than visually impressive pictures. Every pixel represents the result of numerous physical processes, including the interaction of light with matter, atomic transitions, energy distributions, and detector response.
This naturally raises an important question:
How real are the colors we see?
Perhaps an even more important question is:
What additional information can these colors—and the light that creates them—provide beyond the visible image itself?
For modern astronomy, the true value lies not in the image alone, but in the information carried by the photons that form it. The temperature, chemical composition, motion, and in some cases even the evolutionary history of a star can be determined solely through the analysis of its light.
Behind this capability lies a sophisticated combination of optical systems, spectroscopy, semiconductor detectors, and extremely low-noise electronic design.
2. From Photons to Physical Information
Images captured by James Webb or Hubble are often viewed as the final product. From a scientific perspective, however, the real value lies in the information carried by the photons that form those images.
An astronomical observation system does far more than produce pictures. It measures the intensity of incoming light, its wavelength distribution, and its variation over time. These measurements are then translated into physical models that allow astronomers to determine the properties of stars, nebulae, and galaxies.
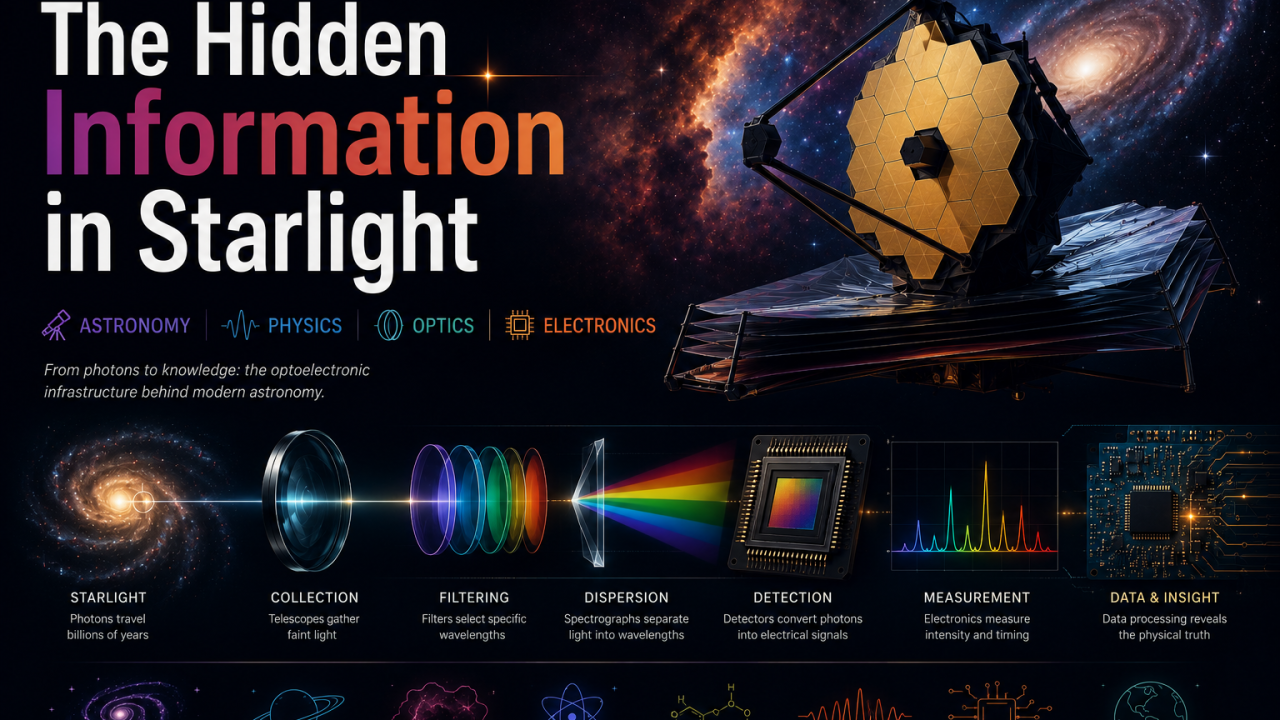
In this process, telescope mirrors are only the first step. The observation chain typically follows:
Primary Mirror → Secondary Optics → Filters → Spectrograph → Detector → Readout Electronics → Data Processing System
Every element in this chain influences the accuracy of the final measurement. The amount of collected light is important, but equally critical is how accurately that light can be measured and how effectively noise can be minimized.
For this reason, detector systems in modern astronomy are often considered just as important as the optical components of the telescope itself.
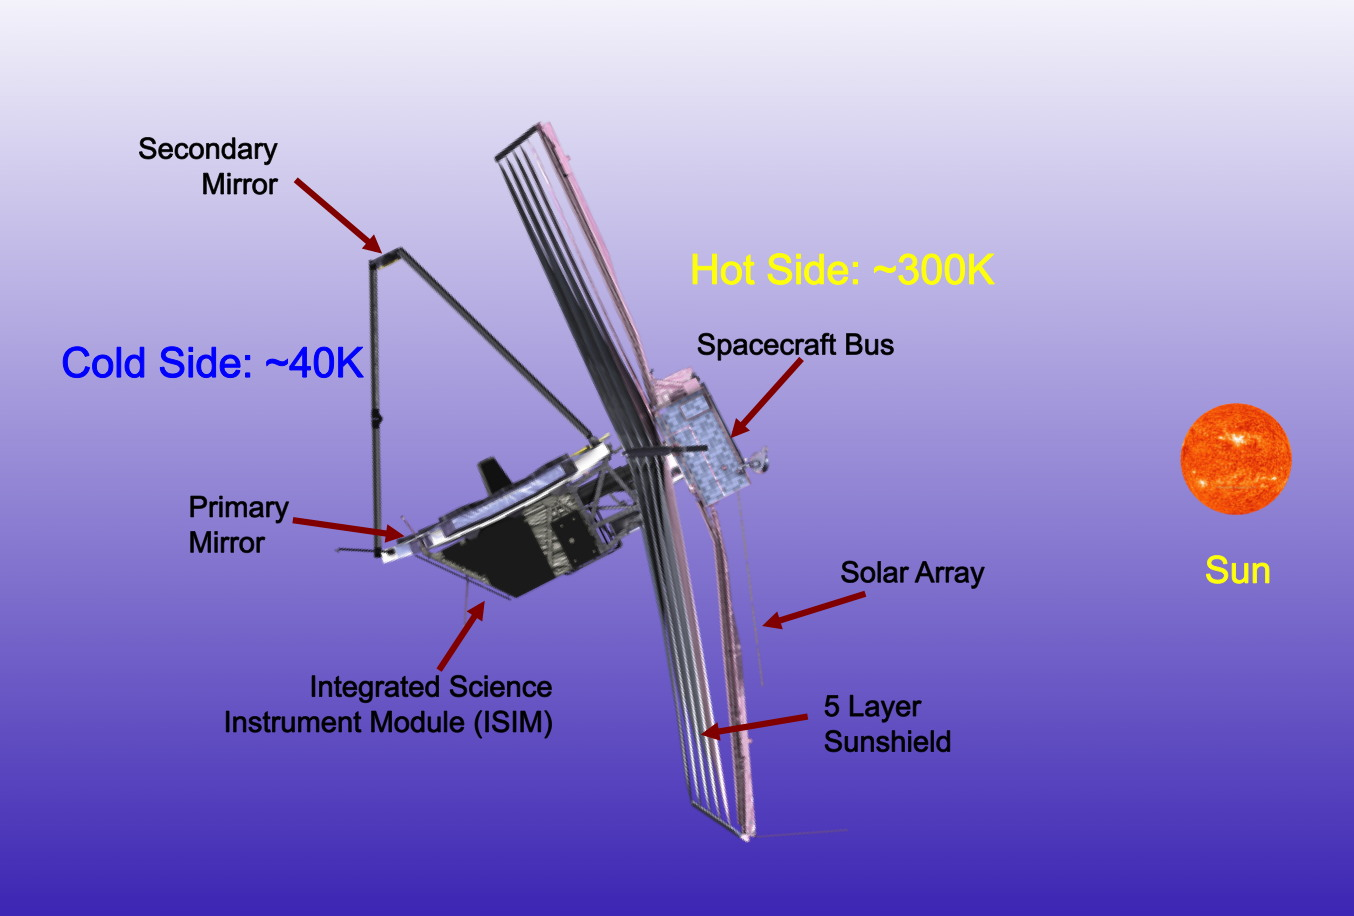 Figure 1. Overview of the James Webb Space Telescope’s optical and instrumentation architecture. After being collected by the primary and secondary mirrors, incoming light is directed to different scientific instruments, including NIRCam, NIRSpec, MIRI, and NIRISS/FGS. As illustrated in Figure 1, modern astronomical observations rely on far more than telescope optics alone. Filters, spectrographs, detectors, readout electronics, and data-processing systems work together to transform incoming photons into scientifically meaningful measurements.
Source: [1]
Figure 1. Overview of the James Webb Space Telescope’s optical and instrumentation architecture. After being collected by the primary and secondary mirrors, incoming light is directed to different scientific instruments, including NIRCam, NIRSpec, MIRI, and NIRISS/FGS. As illustrated in Figure 1, modern astronomical observations rely on far more than telescope optics alone. Filters, spectrographs, detectors, readout electronics, and data-processing systems work together to transform incoming photons into scientifically meaningful measurements.
Source: [1]
3. Why Do Hubble and James Webb Use Different Detectors?
The detector technologies used in astronomical observation systems are directly linked to the wavelength range they are designed to observe. However, the goal is not simply to detect different types of light—it is to extract different kinds of physical information about the universe.
The Hubble Space Telescope was primarily designed to operate in the visible and near-ultraviolet regions of the electromagnetic spectrum. For this reason, CCD-based detectors have long been at the heart of many of Hubble’s imaging instruments. Some of its instruments also employ alternative detector technologies for near-infrared observations.
Observations in the visible spectrum allow astronomers to study:
- Star-forming regions
- Stellar clusters
- The morphological structures of galaxies
- Supernova remnants
- Ionized gas regions
With its exceptional spatial resolution, Hubble has played a crucial role in advancing our understanding of the structure of the universe and the evolution of galaxies.
The James Webb Space Telescope, however, was designed with a different scientific mission in mind.
Its primary objectives include:
- Studying the early universe
- Observing the first generations of galaxies
- Looking through dense dust clouds in star-forming regions
- Analyzing the atmospheres of exoplanets
For these goals, visible light is often insufficient.
As the universe expands, the wavelength of light traveling from distant galaxies becomes stretched. This phenomenon is known as redshift. Light that was originally emitted in the visible spectrum billions of years ago may arrive at Earth today in the near-infrared region.
In addition, dense clouds of dust within star-forming regions strongly absorb visible light, while infrared radiation can penetrate these obscured environments and reveal structures that would otherwise remain hidden.
For this reason, James Webb relies on HgCdTe (Mercury Cadmium Telluride) infrared detectors rather than conventional CCD technology.
As a result, although Hubble and James Webb observe the same universe, they do not collect the same information. Hubble reveals the visible structure of the cosmos with remarkable clarity, while James Webb can explore regions hidden from visible light and investigate much earlier stages of cosmic history.
From this perspective, the physical reality that a telescope can observe is determined not only by its mirrors, but also by the detector technology behind them.
4. Where Do the Colors Come From?
A significant portion of the colors seen in telescope images is not produced using the conventional RGB photography approach.
The primary goal is not to create visually appealing pictures, but to make specific physical processes visible and measurable.
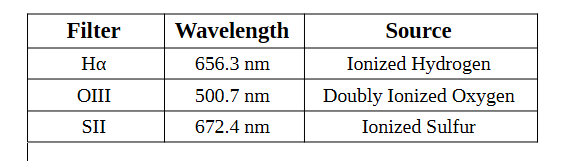
Some of the most commonly used filters in observations of emission nebulae are:
 Source: [7]
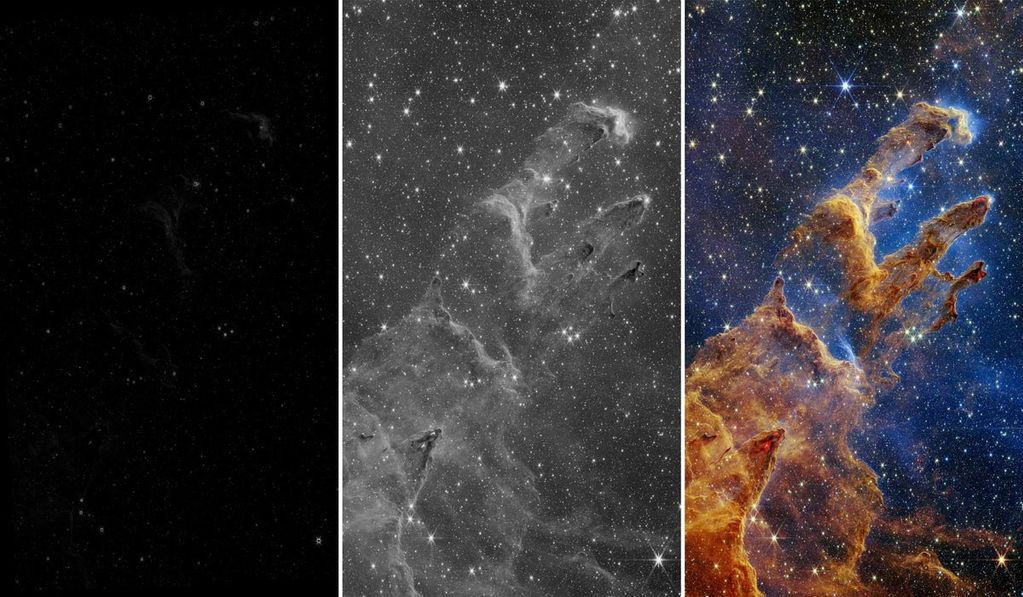
During an observation, the same region is imaged repeatedly through different filters.
When the Hα filter is used, the detector records only the light emitted by ionized hydrogen. The OIII filter highlights oxygen emissions associated with higher-energy regions, while the SII filter can reveal shock fronts and dense gas structures.
The resulting datasets are then assigned to different color channels and combined into a single image.
As a result, the colors seen in astronomical images are often intended to visualize physical information rather than reproduce what the human eye would naturally perceive.
In other words, for an astronomer, color is often not a visual feature—it is a visualization of measurement data.
5. How Does Light Become Information?
Filtering is only the beginning.
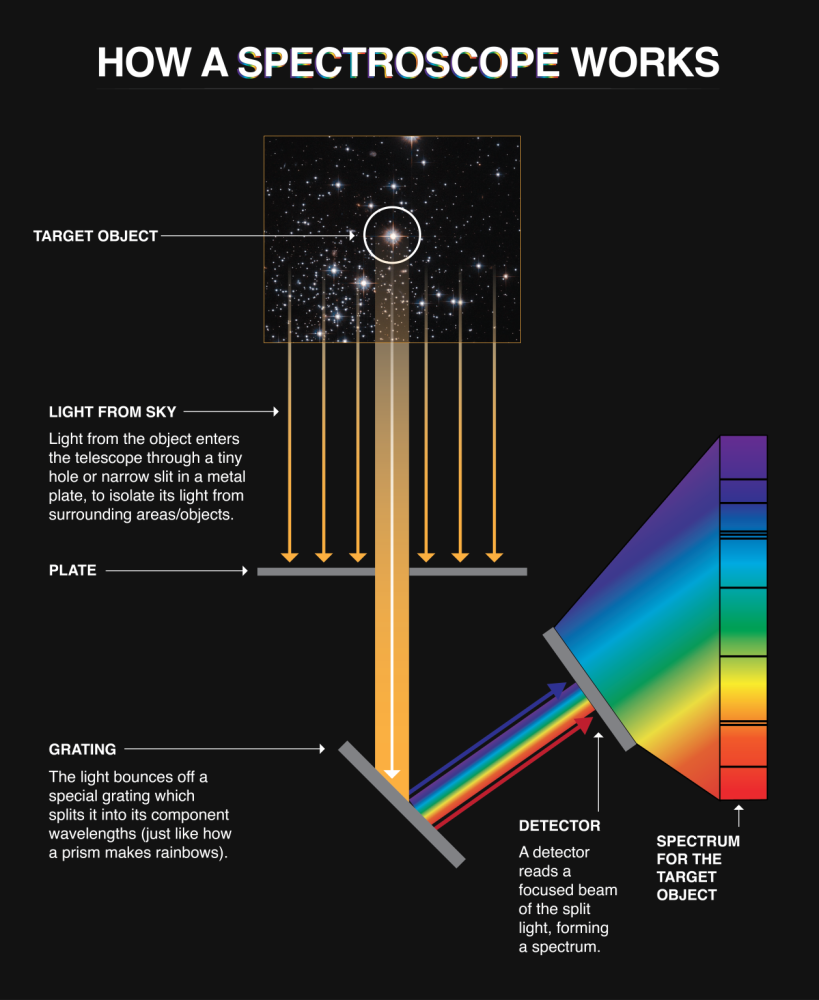
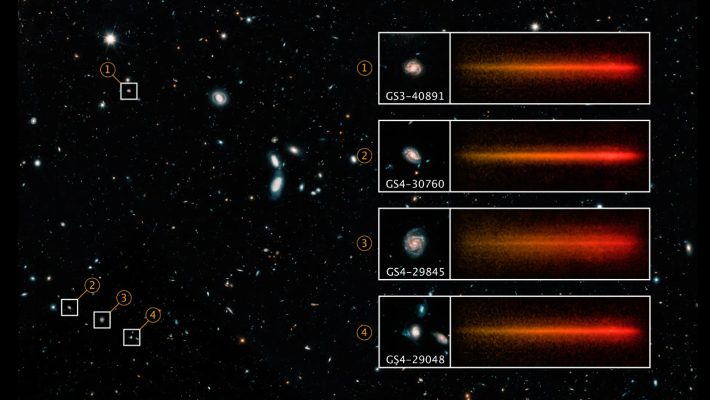
In astronomy, the most valuable information emerges when light is dispersed into its constituent wavelengths using a spectrograph. At the output of a spectrograph, the detector no longer produces a conventional image. Instead, each pixel measures the intensity of light at a specific wavelength.
The resulting spectrum is an extraordinarily rich dataset containing the physical properties of the observed object. In a sense, astronomers do not simply look at images—they read the information hidden within light itself.
Chemical Composition and the “Fingerprints” of Stars
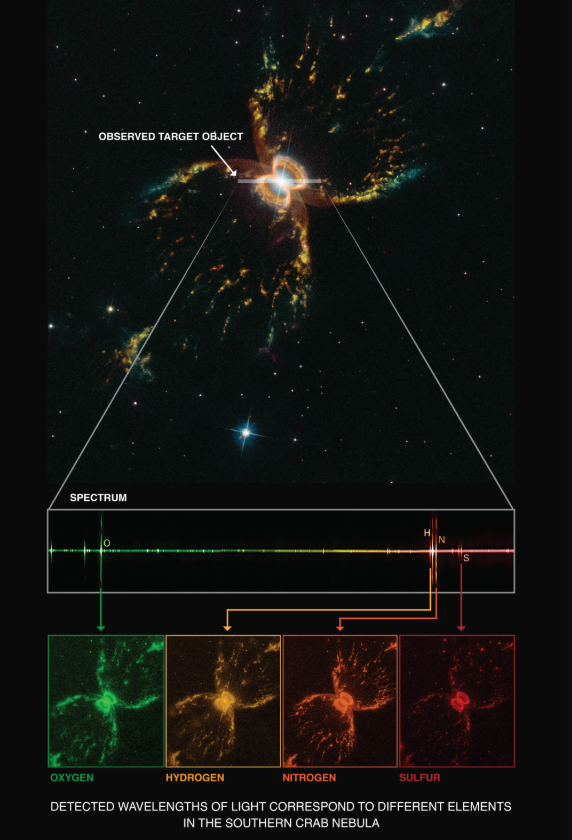
Every atom possesses discrete energy levels and can therefore emit or absorb light only at specific wavelengths.
Elements such as hydrogen, helium, oxygen, calcium, and sodium each produce unique spectral lines. These lines can be thought of as atomic fingerprints, allowing astronomers to identify the elements present in distant astronomical objects.
However, the goal is not merely to determine which elements are present. By analyzing the intensity, width, and shape of spectral lines, astronomers can also estimate elemental abundances, ionization states, and the physical conditions within stellar atmospheres.
For example, two stars may both contain hydrogen. Yet if the relative strengths of their hydrogen lines differ, this may indicate differences in temperature, atmospheric structure, or other physical properties.
Even more remarkably, the abundance of heavier elements can provide clues about when a star formed. As a result, astronomers can often infer not only what a star is made of, but also how old it may be, simply by analyzing its spectrum.
Temperature
The temperature of a star cannot be measured directly.
Instead, astronomers examine how the emitted energy is distributed across different wavelengths.
According to physics, the radiation emitted by an ideal blackbody depends on its temperature. As temperature increases, the peak of the emitted energy distribution shifts toward shorter wavelengths. Consequently, hotter stars emit more strongly in the blue region of the spectrum, while cooler stars appear shifted toward longer, redder wavelengths.
In modern astronomy, however, temperature estimation is not based solely on color. The entire spectral distribution, together with the behavior of specific absorption lines, is evaluated. By comparing measured spectra with physical models, astronomers can determine a star’s effective surface temperature with high accuracy.
In reality, a telescope does not measure temperature. It measures the energy distribution of incoming photons. Temperature is obtained through the physical interpretation of those measurements.
Motion, Rotation, and Exoplanets
A star’s velocity is not measured directly either.
Instead, astronomers examine the positions of characteristic spectral lines. If hydrogen, helium, calcium, or other lines whose laboratory wavelengths are precisely known appear shifted from their expected positions, the most likely cause is the Doppler effect.
If a star is moving away from the observer, its spectral lines shift toward longer wavelengths, producing a redshift. If it is approaching, the lines shift toward shorter wavelengths, producing a blueshift.
These shifts are often only tiny fractions of a nanometer. Nevertheless, modern spectrographs are capable of measuring them with extraordinary precision.
Doppler analysis is useful for far more than measuring stellar velocities. The broadening of spectral lines can reveal a star’s rotational speed, while periodic variations in line position may indicate the presence of an orbiting planet.
Many of the exoplanets discovered today have never been directly imaged. Their existence was inferred from the extremely small Doppler shifts they induce in the spectra of their host stars.
6. Detector Technologies: Measuring Just a Few Photons
No matter how large a telescope’s mirror may be, the ultimate limit of an observation is often determined by the detector.
In systems such as the James Webb Space Telescope, the signals being measured can be extraordinarily weak. In some cases, the information reaching the detector consists of only a handful of photons. For this reason, the role of an astronomical detector is not simply to create an image, but to measure the smallest possible optical signals with the highest achievable reliability.
What distinguishes astronomical detectors from ordinary imaging sensors is therefore not resolution alone, but measurement accuracy.
A smartphone camera may contain millions of pixels. In astronomy, however, the key question is not how many pixels are available, but how many of the incoming photons can be measured accurately and with minimal loss.
Sensor Technologies Used in Astronomy
Astronomical observations do not rely on a single detector technology.
The brightness of the target, the physical parameters being measured, the required readout speed, and the wavelength range of interest all influence the choice of sensor technology. As a result, modern astronomy employs a variety of detector architectures, including CCD, CMOS, sCMOS, EMCCD, and HgCdTe detectors.
The differences between these technologies extend far beyond image formation. Characteristics such as readout noise, quantum efficiency (QE), dynamic range, data transfer speed, and spectral sensitivity determine which detector is best suited for a particular scientific application.
CCD
CCD (Charge-Coupled Device) detectors have long been regarded as the reference imaging technology for astronomy.
Their excellent pixel uniformity, low fixed-pattern noise, and highly accurate photometric performance made them the preferred choice for many scientific imaging systems for decades.
In CCD architectures, however, the charge accumulated in each pixel must be transferred sequentially across the sensor before being read out. While this approach provides excellent measurement precision, it limits readout speed and can increase power consumption in large-format detectors.
CMOS and sCMOS
In CMOS (Complementary Metal-Oxide-Semiconductor) sensors, each pixel contains its own readout circuitry. This enables parallel readout and significantly higher data rates compared with CCD systems. Combined with lower power consumption and high integration density, CMOS technology has become the dominant imaging technology in many modern applications.
Early CMOS sensors did not provide the performance required for demanding scientific observations. Higher readout noise and pixel-to-pixel variations meant that CCD technology remained the preferred choice for astronomy for many years.
Advances in semiconductor manufacturing eventually led to the development of sCMOS (scientific CMOS) sensors, specifically optimized for scientific measurements.
Today, sCMOS detectors can offer low readout noise, high frame rates, wide dynamic range, and high quantum efficiency within a single system. These characteristics make them particularly valuable in adaptive optics systems, high-speed astronomical observations, and applications requiring large data volumes.
EMCCD
In some astronomical observations, the detected signal may fall to only a few photons.
For these applications, EMCCD (Electron-Multiplying CCD) technology is often used.
In EMCCD devices, the signal is electronically amplified before reaching the readout stage. This significantly reduces the impact of readout noise and enables measurements at extremely low light levels.
The technology is highly effective for photon-starved observations, although it introduces additional noise mechanisms, offers a more limited dynamic range, and generally comes with higher cost.
HgCdTe and Infrared Detectors
In systems such as the James Webb Space Telescope, the primary limitation is no longer electronics but material physics.
Most CCD, CMOS, and sCMOS sensors are based on silicon. Due to the physical properties of silicon, detection efficiency begins to decline rapidly beyond approximately 1 µm.
Many of the objects Webb was designed to study, however, emit most of their radiation in the near- and mid-infrared regions. Examples include early-universe galaxies, star-forming regions, structures hidden behind dense dust clouds, and exoplanet atmospheres.
For this reason, Webb’s near-infrared instruments employ HgCdTe (Mercury Cadmium Telluride) detectors. These devices provide high sensitivity well beyond the visible spectrum and into the infrared region.
Importantly, HgCdTe is not used because it is universally “better” than CCD or CMOS technology. The detector technology is selected according to the wavelength range and measurement requirements dictated by the scientific problem being investigated.
In astronomy, the best detector is not the most advanced one—it is the one that can extract the required information from the available photons most effectively.
7. Key Parameters That Define Detector Performance
In astronomical observation systems, the amount of scientific information that can ultimately be extracted is often limited by detector performance.
No matter how large a telescope may be, observation quality is directly affected if the arriving photons cannot be measured efficiently or become buried beneath electronic noise.
For this reason, when evaluating astronomical detectors, measurement performance is often far more important than resolution alone.
Quantum Efficiency (QE)
Quantum Efficiency (QE) describes the fraction of incoming photons that are successfully converted into measurable electrical charge.
For example, a detector with a QE of 80% can convert approximately 80 out of every 100 incident photons into measurable electrons.
This parameter is particularly important when observing faint astronomical sources, because every lost photon represents scientific information that can never be recovered.
As a result, modern astronomical detectors are designed not only for high peak QE, but also for maintaining high quantum efficiency across the wavelength range of interest.
Readout Noise
Readout noise is the electronic noise introduced during the process of reading out the charge accumulated in each pixel.
In astronomical observations, the detected signal may sometimes consist of only a few electrons. Under such conditions, readout noise can become comparable to the signal itself.
Low readout noise is therefore critical, particularly in long-exposure observations and extremely low-light applications.
Many modern scientific cameras achieve readout noise levels of only a few electrons, and in some cases even below a single electron.
Dark Current
Even in complete darkness, thermal energy causes a detector to generate electrons.
This effect, known as dark current, introduces an unwanted signal that accumulates during long exposures.
The problem becomes especially significant in infrared astronomy, where the detector’s own thermal emissions can approach the level of the signal being measured.
For this reason, many scientific imaging systems employ thermoelectric or cryogenic cooling. One of the reasons why the infrared detectors aboard the James Webb Space Telescope operate at extremely low temperatures is to minimize dark current and thermal noise.
Dynamic Range
Astronomical images often contain both extremely bright stars and exceptionally faint structures within the same field of view.
Dynamic range describes the ratio between the largest signal a detector can measure before saturation and the smallest detectable signal.
A wide dynamic range allows faint nebulae and galaxies to be analyzed without losing detail in brighter objects within the same image.
Linearity
In scientific measurements, detecting a signal is not enough—the signal must also be measured accurately.
Linearity describes how closely the detector output remains proportional to the amount of incoming light.
Ideally, if the number of incident photons doubles, the measured signal should also double.
High linearity is particularly important in photometry, spectroscopy, and other applications requiring precise quantitative measurements.
PRNU and DSNU
Two additional parameters that influence detector performance are PRNU (Photo Response Non-Uniformity) and DSNU (Dark Signal Non-Uniformity).
PRNU describes variations in the response of individual pixels when exposed to the same illumination level.
DSNU refers to differences in dark current between pixels when operating without incident light.
Although these effects can often be corrected through calibration procedures, they remain important considerations in high-precision astronomical measurements.
Ultimately, the performance of an astronomical detector is not determined by how many megapixels it contains, but by how efficiently it collects photons, how little noise it introduces, and how accurately it converts incoming light into measurable data.
A Practical Example: Performance in Scientific Cameras
The significance of these parameters becomes clearer when examining real scientific imaging systems.
The Hamamatsu ORCA-Flash4.0 V3 sCMOS camera, for example, offers a peak quantum efficiency of approximately 82% and readout noise approaching the one-electron level. These characteristics enable reliable measurements at extremely low light levels.
Similarly, some imaging systems at the Subaru Telescope, one of the world’s largest ground-based observatories, employ Hamamatsu CCD and CMOS detector technologies for demanding astronomical observations.
Space-based systems often require different solutions. The NIRCam instrument aboard the James Webb Space Telescope uses Teledyne’s HAWAII-2RG (H2RG) HgCdTe infrared detectors. These detectors operate across an approximate wavelength range of 0.6–5 µm, enabling observations far beyond the visible spectrum and deep into the infrared region.
These examples illustrate an important principle: astronomy does not have a single “best” sensor technology. While the same performance metrics apply to all detectors, the optimal technology depends entirely on the scientific problem being addressed.
8. Conclusion
When we look at the colorful images produced by the James Webb Space Telescope, we often see the visual grandeur of the universe. Yet from the perspective of an optoelectronics engineer, a very different story emerges.
Photons are collected by mirrors, selected by filters, separated by spectrographs, converted into electrical signals by detectors, and measured by ultra-low-noise electronic systems. What ultimately emerges is not merely an image, but a measurement of the physical information carried by light that has traveled across the universe for billions of years.
Perhaps this is one of the most remarkable achievements of modern astronomy: the ability to determine the temperature, chemical composition, motion, and even the evolutionary history of a star without ever traveling to it.
Even more fascinating is the fact that these technologies are not confined to astronomy alone. Detector technologies and measurement techniques originally developed to measure only a few photons from distant galaxies are now used in scientific cameras, spectroscopic analysis systems, environmental monitoring instruments, medical imaging applications, flame detectors, gas analysis systems, and a wide range of industrial sensors.
For this reason, astronomy is not merely a scientific discipline dedicated to understanding the universe. It is also a powerful driver of innovation that continuously pushes the boundaries of optics, electronics, and measurement technology.
Perhaps the greatest achievement of James Webb is not simply that it shows us the universe, but that it demonstrates how far humanity has advanced in its ability to measure light.
References
[1] Space Telescope Science Institute (STScI), JWST Observatory Overview
https://jwst-docs.stsci.edu/jwst-observatory-hardware/jwst-observatory-overview
[2] NASA, Hubble Spectroscopy – Science Behind the Discoveries
https://science.nasa.gov/mission/hubble/science/science-behind-the-discoveries/hubble-spectroscopy/
[3] NASA, James Webb Space Telescope Mission Overview
https://science.nasa.gov/mission/webb/
[4] Space Telescope Science Institute (STScI), NIRCam Documentation
https://jwst-docs.stsci.edu/jwst-near-infrared-camera
[5] Space Telescope Science Institute (STScI), NIRSpec Documentation
https://jwst-docs.stsci.edu/jwst-near-infrared-spectrograph
[6] Subaru Telescope, National Astronomical Observatory of Japan
[7] European Space Agency (ESA), Webb Telescope Image Archive
[8] NASA / STScI, Webb Telescope Image Gallery